Visual Communications

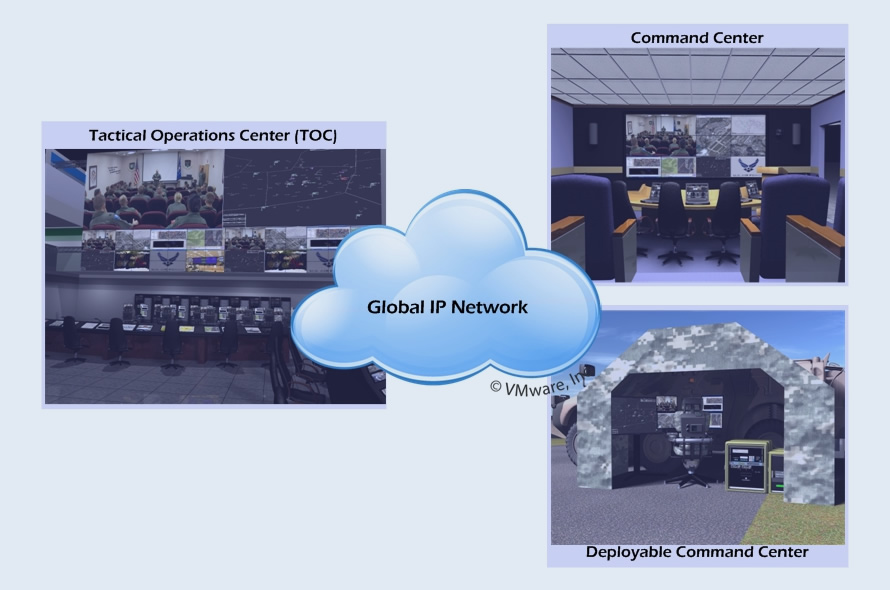
Visualization is traditionally viewed as an efficient way of transferring a large amount of information from a data source to a point of display for a viewer to conceptualize as an image. Our experience has shown that visualizations become even more powerful when multiple people access display points for collaboration. By creating and designing pristine graphical display solutions that spark the exchange of ideas and insights, we exponentially enhance the social and communicative value of information visualization. At Acquiese, we develop visualizations that help viewers see and exchange information in novel ways. Our designs aim to transform visualization from a solitary activity into a collaborative one. Examples of scientific visualizations are computer generated images which show real spacecraft in action, out in the void far beyond Earth, or on other planets. Dynamic forms of visualization such as military animation have the potential to enhance wargaming, exercise maneuvers and mobilization that change over time.
By allowing people to observe and orient themselves in complex information landscapes, our inventions enable faster, more insightful decisions can be made. Therefore, our approach surrounds creating the ending by addressing the source. In other words, Acquiese’s Program & Business Managers create 3D customized renditions of our clients’ initial requirements, whether conceptional or true observations, to depict the resultant end product. This is performed in real time and prior to the start of any project. We accomplish this through a series of predefine visualization development measures: Requirements Analysis: To provide clients with a rendering that even slightly matches their preconceived notion, we must clearly understand what is trying to be achieved. Scientific and Information visualization are concerned with the presentation of interactive or animated digital images to users to understand data. For example, scientists interpret potentially huge quantities of laboratory or simulation data or the results from sensors out in the field to aid reasoning, hypothesis building and cognition. The field of data mining offers many abstract visualizations related to these visualization types. They are active research areas, drawing on theory in information graphics, computer graphics, human-computer interaction and cognitive science and also, of course, visual communication design. More and more scientists and engineers are entering collaborations with graphic designers in the realization of data visualization systems and solutions created by Acquiese. Scientific visualization deals with data that has a natural geometric structure (e.g., MRI data, wind flows), whereas information visualization handles more abstract data structures such as trees or graphs. Visual analytics is especially concerned with sense-making and reasoning. User Interface Design: The user interface design or user interface engineering is the design of the controlling device with the focus on the user's experience and interaction. Unlike traditional design where the goal is to make the object or application physically attractive, the goal of user interface design is to make the user's interaction experience as simple and intuitive as possible—what is often called user-centered design. Where good graphic/industrial design is bold and eye catching, good user interface design is often subtle and invisible. User Interface design is involved in a wide range of project aspects from touch panels to software applications to display systems to video controllers; all of these items have some things in common, yet also require some unique skills and knowledge. As a result, Acquiese User Interface Designers do not specialize in specific types of equipment only, but have experience and have skills centered around their expertise, whether that be software design, web design, or industrial design that allow them to collaborate in a team environment efficiently and quickly to undertake a vast array of equipment types. What all these devices have in common is, of course, the focus on how the user interacts with the device/system/application to enhance the visualization experience. Visualization Type: Apart from the distinction between interactive visualizations and animation, the most useful categorization is probably between abstract and model-based scientific visualizations. The abstract visualizations show completely conceptual constructs in 2D or 3D. These generated shapes are completely arbitrary. The model-based visualizations either place overlays of data on real or digitally constructed images of reality, or they make a digital construction of a real object directly from the scientific data. The primary client usage or requirement will dictate the type of visualization Acquiese will employ.